top of page

Search


Relative Strength Index
What is Relative Strength Index? The Relative Strength Index (RSI) is a momentum indicator used by technical analysts to gauge whether...
sarabjeetkaur901
May 6, 20221 min read


Volatility
The volatility of a security is the expected fluctuation of its price at any given time. The expectation is based on the asset's standard...
sarabjeetkaur901
May 6, 20221 min read


Hedge Funds
Hedge funds are private investment vehicles that are offered and managed by professional investment firms, usually set up as LLCs, LLPs...
amritakumar413
May 6, 20221 min read


Earnings Calendar
An earnings calendar is the quarterly schedule and timetable laying out individual release dates of financial reports containing...
sarabjeetkaur901
May 5, 20221 min read


Initial Coin Offering
New cryptocurrencies can gain traction as well as market capitalization via an initial coin offering (ICO). ICOs are similar in spirit to...
amritakumar413
May 4, 20221 min read


Average True Range
Average True Range (ATR) is the average of true ranges over the specified period. ATR measures volatility, taking into account any gaps...
sarabjeetkaur901
May 3, 20221 min read


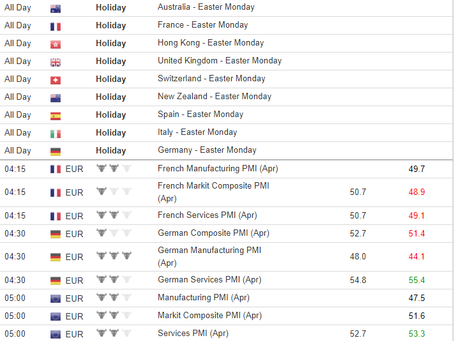
Economic Calendar
The economic calendar refers to the scheduled dates of significant releases or events that may affect the movement of individual security...
amritakumar413
May 2, 20221 min read


Pivot Point
What is Pivot Point? In financial markets, a pivot point is a price level that is used by traders as a possible indicator of market...
sarabjeetkaur901
Apr 30, 20221 min read


Cardano
Cardano is a blockchain platform that aims to be a decentralized application (DApp) development platform with a multi-asset ledger and...
amritakumar413
Apr 30, 20221 min read


Fed Rate Monitor Tool
What is Fed Rate Monitor Tool? The federal funds rate influences the prime rate, which is the base rate from which other interest rates...
sarabjeetkaur901
Apr 29, 20221 min read


Alligator Indicator
Bill Williams created the Alligator Indicator, which is a technical analysis tool that uses smoothed moving averages. Alligator is used...
amritakumar413
Apr 27, 20221 min read


portfolio possibility curve
Portfolio Possibilities Curve is a term from portfolio theory referring to all of the lowest-risk portfolios. At each level of return,...
Neel Patel
Mar 5, 20221 min read


50% retracement theory
what is 50% retracement theory? The 50% retracement rule states that an index or a stock retracts half the value of the decline or the...
Neel Patel
Mar 4, 20221 min read


Price action charts
What are Price Action Charts? Price action generally refers to the up and down movement of a security's price when it is plotted over...
Neel Patel
Mar 3, 20221 min read


Chart Patterns
What are Chart patterns? A chart pattern is a shape within a price chart that helps to suggest what prices might do next, based on what...
Neel Patel
Mar 1, 20221 min read


Trading Indicators
What are Trading Indicators? Trading indicators are mathematical calculations, which are plotted as lines on a price chart and can help...
Neel Patel
Feb 28, 20221 min read


Economic Calendars
What are Economic calendars? The economic calendar refers to the scheduled dates of significant releases or events that may affect the...
Neel Patel
Feb 27, 20221 min read


Carry forward strategy
What is a cash and carry forward strategy? A cash-and-carry trade is a trading strategy that an investor can utilize in order to take...
Neel Patel
Feb 26, 20221 min read


Copy Trading
what is Copy trading? Copy-trading enables individuals in the financial markets to automatically copy positions opened and managed by...
Neel Patel
Feb 25, 20221 min read


Algo Trading
what is Algo trading? Algorithmic trading uses a computer program that follows a defined set of instructions (an algorithm) to place a...
Neel Patel
Feb 24, 20221 min read
bottom of page